Will today’s oil “shock” be less shocking than the 1970s embargoes?
12 April 2022
6 minute read
It’s not only motorists who are hit in the pocket when oil prices rise rapidly. Investors can suffer too and history tells us that when the world is dealing with an oil supply crisis – like with today’s Russia-Ukraine conflict – the direction of oil prices and equity returns tend to move in opposite directions.
Yet, it’s not all bad news. While past performance is never a guarantee of future performance, a look back over time shows that these oil “shocks” appear to be becoming less shocking – with developed-market economies having become increasingly resilient to such events.
Our review takes in the last 50 years – looking at the impact on stock markets of the 1973 Arab oil embargo, the Iranian revolution of 1979, the 1990 Gulf War, the pre-financial crisis oil price “bubble” of 2007/08, and the more recent pandemic-related oil rebound of late 2021 amid loosening COVID-19 restrictions, among other events.
Identifying supply-driven oil shocks in last 50 years
In our analysis, “shock” periods were defined as when the price of both Brent crude, the global benchmark for oil prices, and West Texas Intermediate, the US measure, increased by more than 20% from low to peak, allowing for at most 10 days of correction.
We then combined data from the Federal Reserve Bank of New York’s ‘Oil Price Dynamics Report’1 to work out if these increases were mostly supply-driven factors. The New York Fed provided no data from 1973-79, but oil shocks in this period are well known to have been caused by supply restrictions following conflicts.
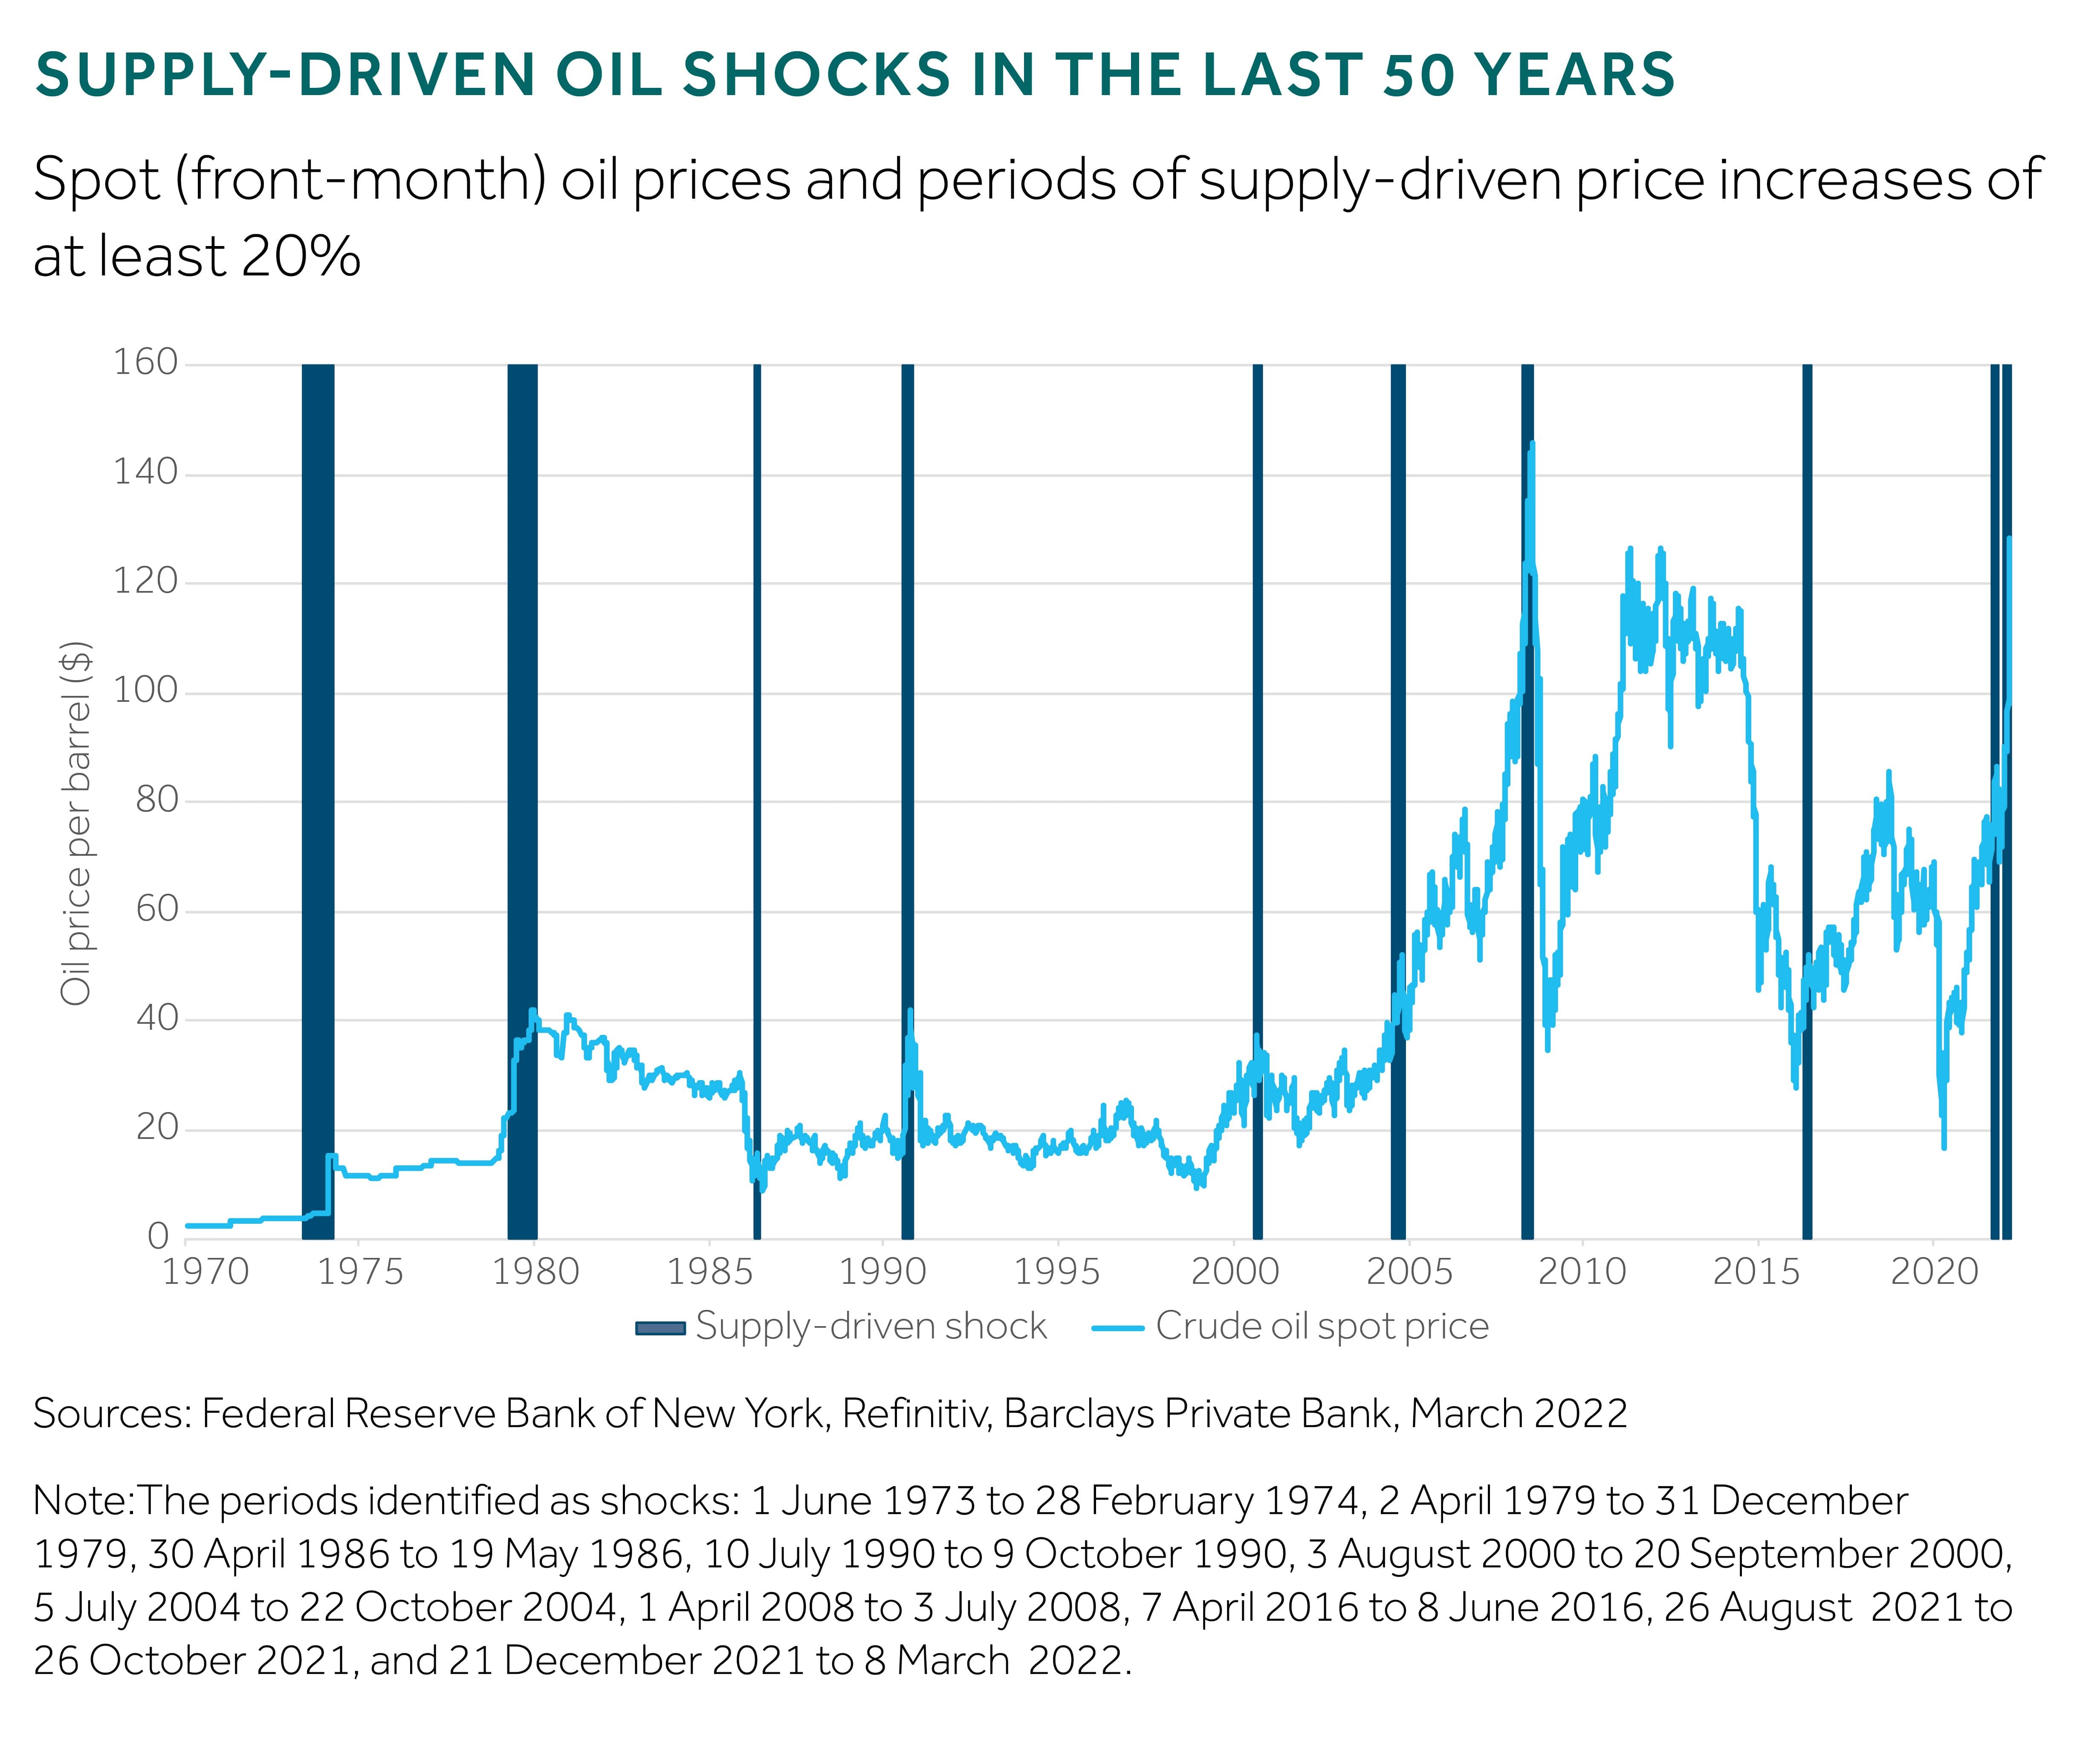
This left us with 10 supply-driven shocks in the last 50 years that we’ve examined (excluding the current crisis), which typically lasted five months, and with the price of oil peaking at an average of 79% above its starting price (see chart below).
Lessons from the past
Since the 2007-09 global financial crisis, stock market returns have broadly correlated with the price of oil – especially when energy prices have risen gently, which has generally coincided with periods of stronger economic activity.
It’s only when the oil supply drops and prices surge, often on a sustained basis, that correlations change – and recessions have also tended to follow.
And when you look at the data over the last 50 years, global stock markets have typically hit their low point seven months after the start of a supply-driven oil shock, with average losses of 7% (see chart below) – although these losses are generally recovered after nine months.
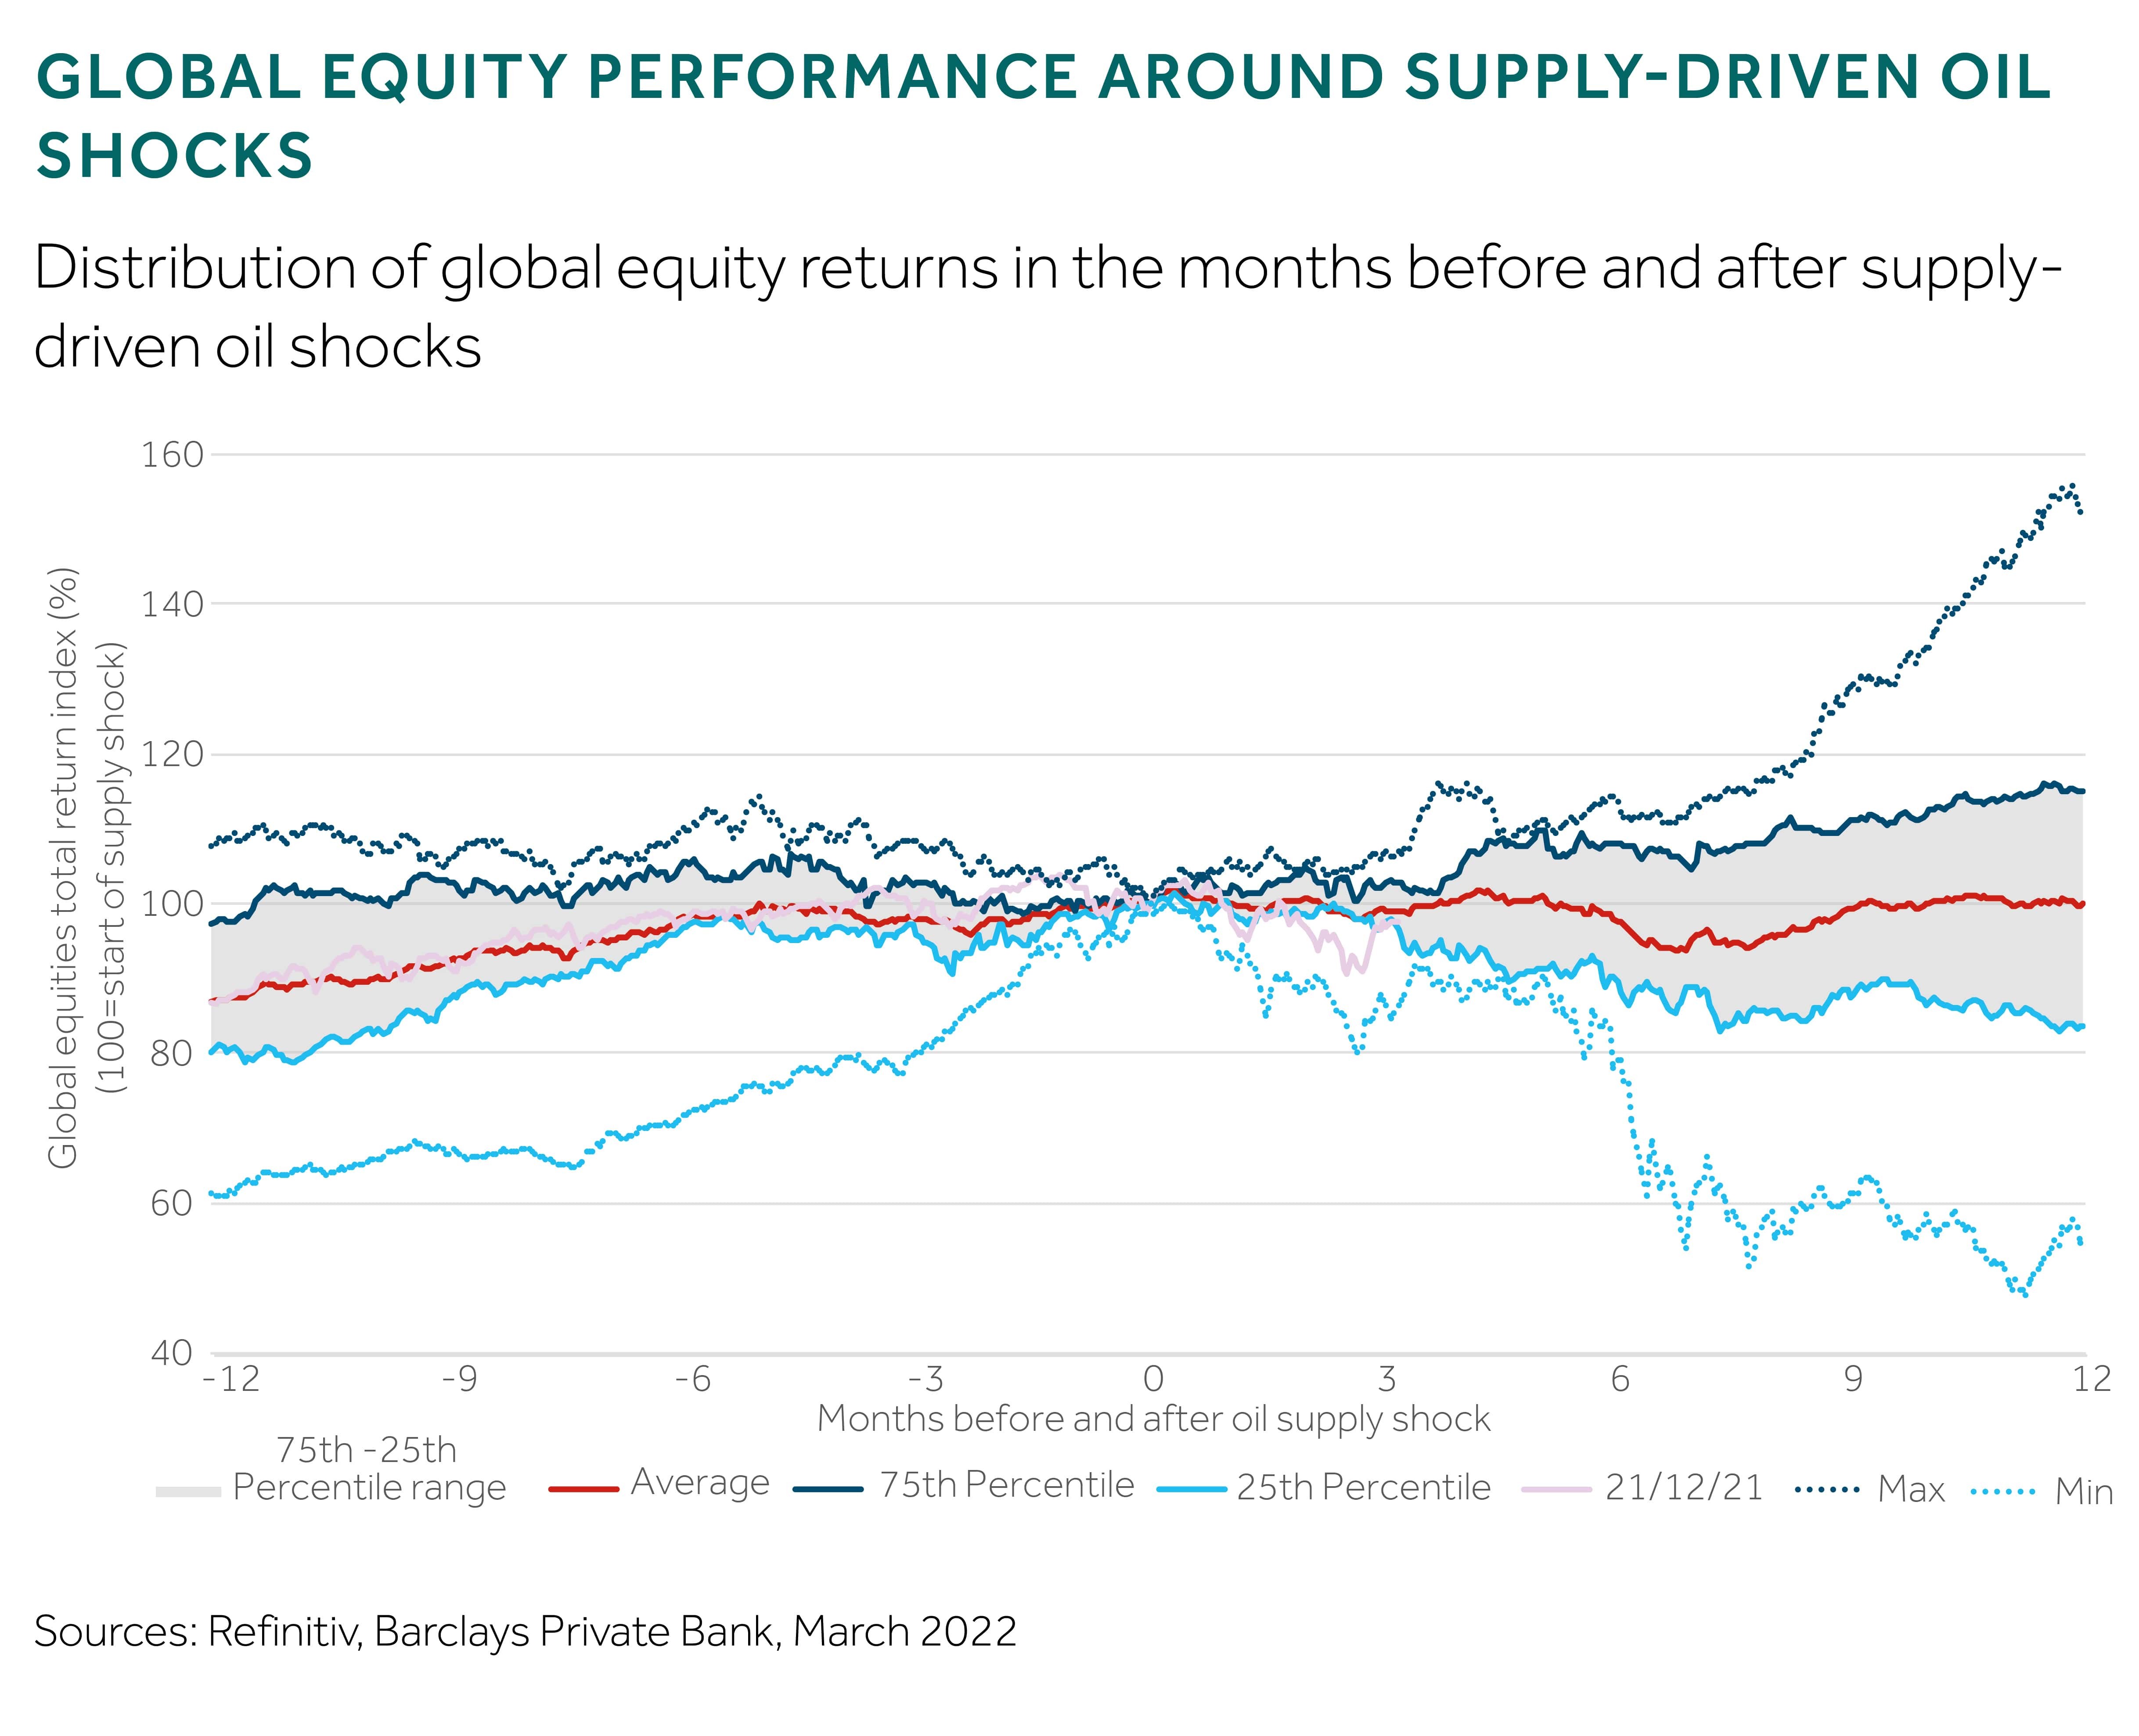
The worst hit to stocks (in the time period reviewed) came in March 2009 when equities fell 52% from the start of the April 2008 oil shock. Of course, by early March 2009 we were at the low point of the global financial crisis when stock markets were in turmoil from the financial crisis itself rather than any preceding oil shock.
The second-worst drawdown happened in October 1974 – 16 months after Arab oil producers imposed their embargo, punishing the West in response to supporting Israel in the Yom Kippur war against Egypt – with equities declining 39% over the period.
More recently, there was the August-October 2021 oil shock, when the world was trying to bounce back from COVID-19. With demand for oil rising, the oil cartel OPEC shocked markets with hints of potential supply shortages. In the aftermath, some UK petrol stations started running out of fuel – sparking panic-buying by spooked motorists, as fuel shortages sent oil prices soaring. However, the most equities fell in the period was just 9% – and that was six months after the crisis began (although the timeframes for this oil shock overlap with the current crisis).
Supply shocks of the magnitude of 1973-74 and 2008-09 are therefore thankfully rare. Although the Russia-Ukraine conflict is starting to look like one of the biggest disruptions to the global oil market since the Gulf War of 1990.
The situation today
As of end-March 2022, the price of Brent crude remained above $100 a barrel2 – with prices around four times higher than they were just two years ago.
The highly unpredictable Russia-Ukraine war has meant Brent crude moving from $98 a barrel on 25 February, before the invasion by Russia, to $128 on 8 March, and then briefly back below $100 in mid-March, before heading upwards again.
Energy prices, and commodities in general, are likely to remain volatile until there’s more clarity in eastern Europe. But there’s a real danger that if the crisis deepens or becomes more entrenched, it may even trigger a recession.
Are we in a better place to deal with the crisis, this time around?
There are, however, several reasons to think countries will be more resilient today than they were back in the 1970s and 1980s, when an oil crisis could cause large-scale economic shock.
- The world is less energy intensive: Today, the US generates almost three times as much output for every unit of energy consumed than it did in 1970. For Europe, this figure is more than two times.
- Economies are more robust: Countries have come into this supply-shock crisis with strong economic momentum and above-trend growth.
- Consumers have built up large savings: Many households amassed big cash piles during the COVID-19 pandemic, aided by government spending initiatives – allowing them to absorb higher energy costs.
- Potential tax cuts or price caps to shield the most vulnerable: More fiscal measures could also be brought in to mitigate the impact of high commodity prices on consumers.
Market trends during oil supply shocks
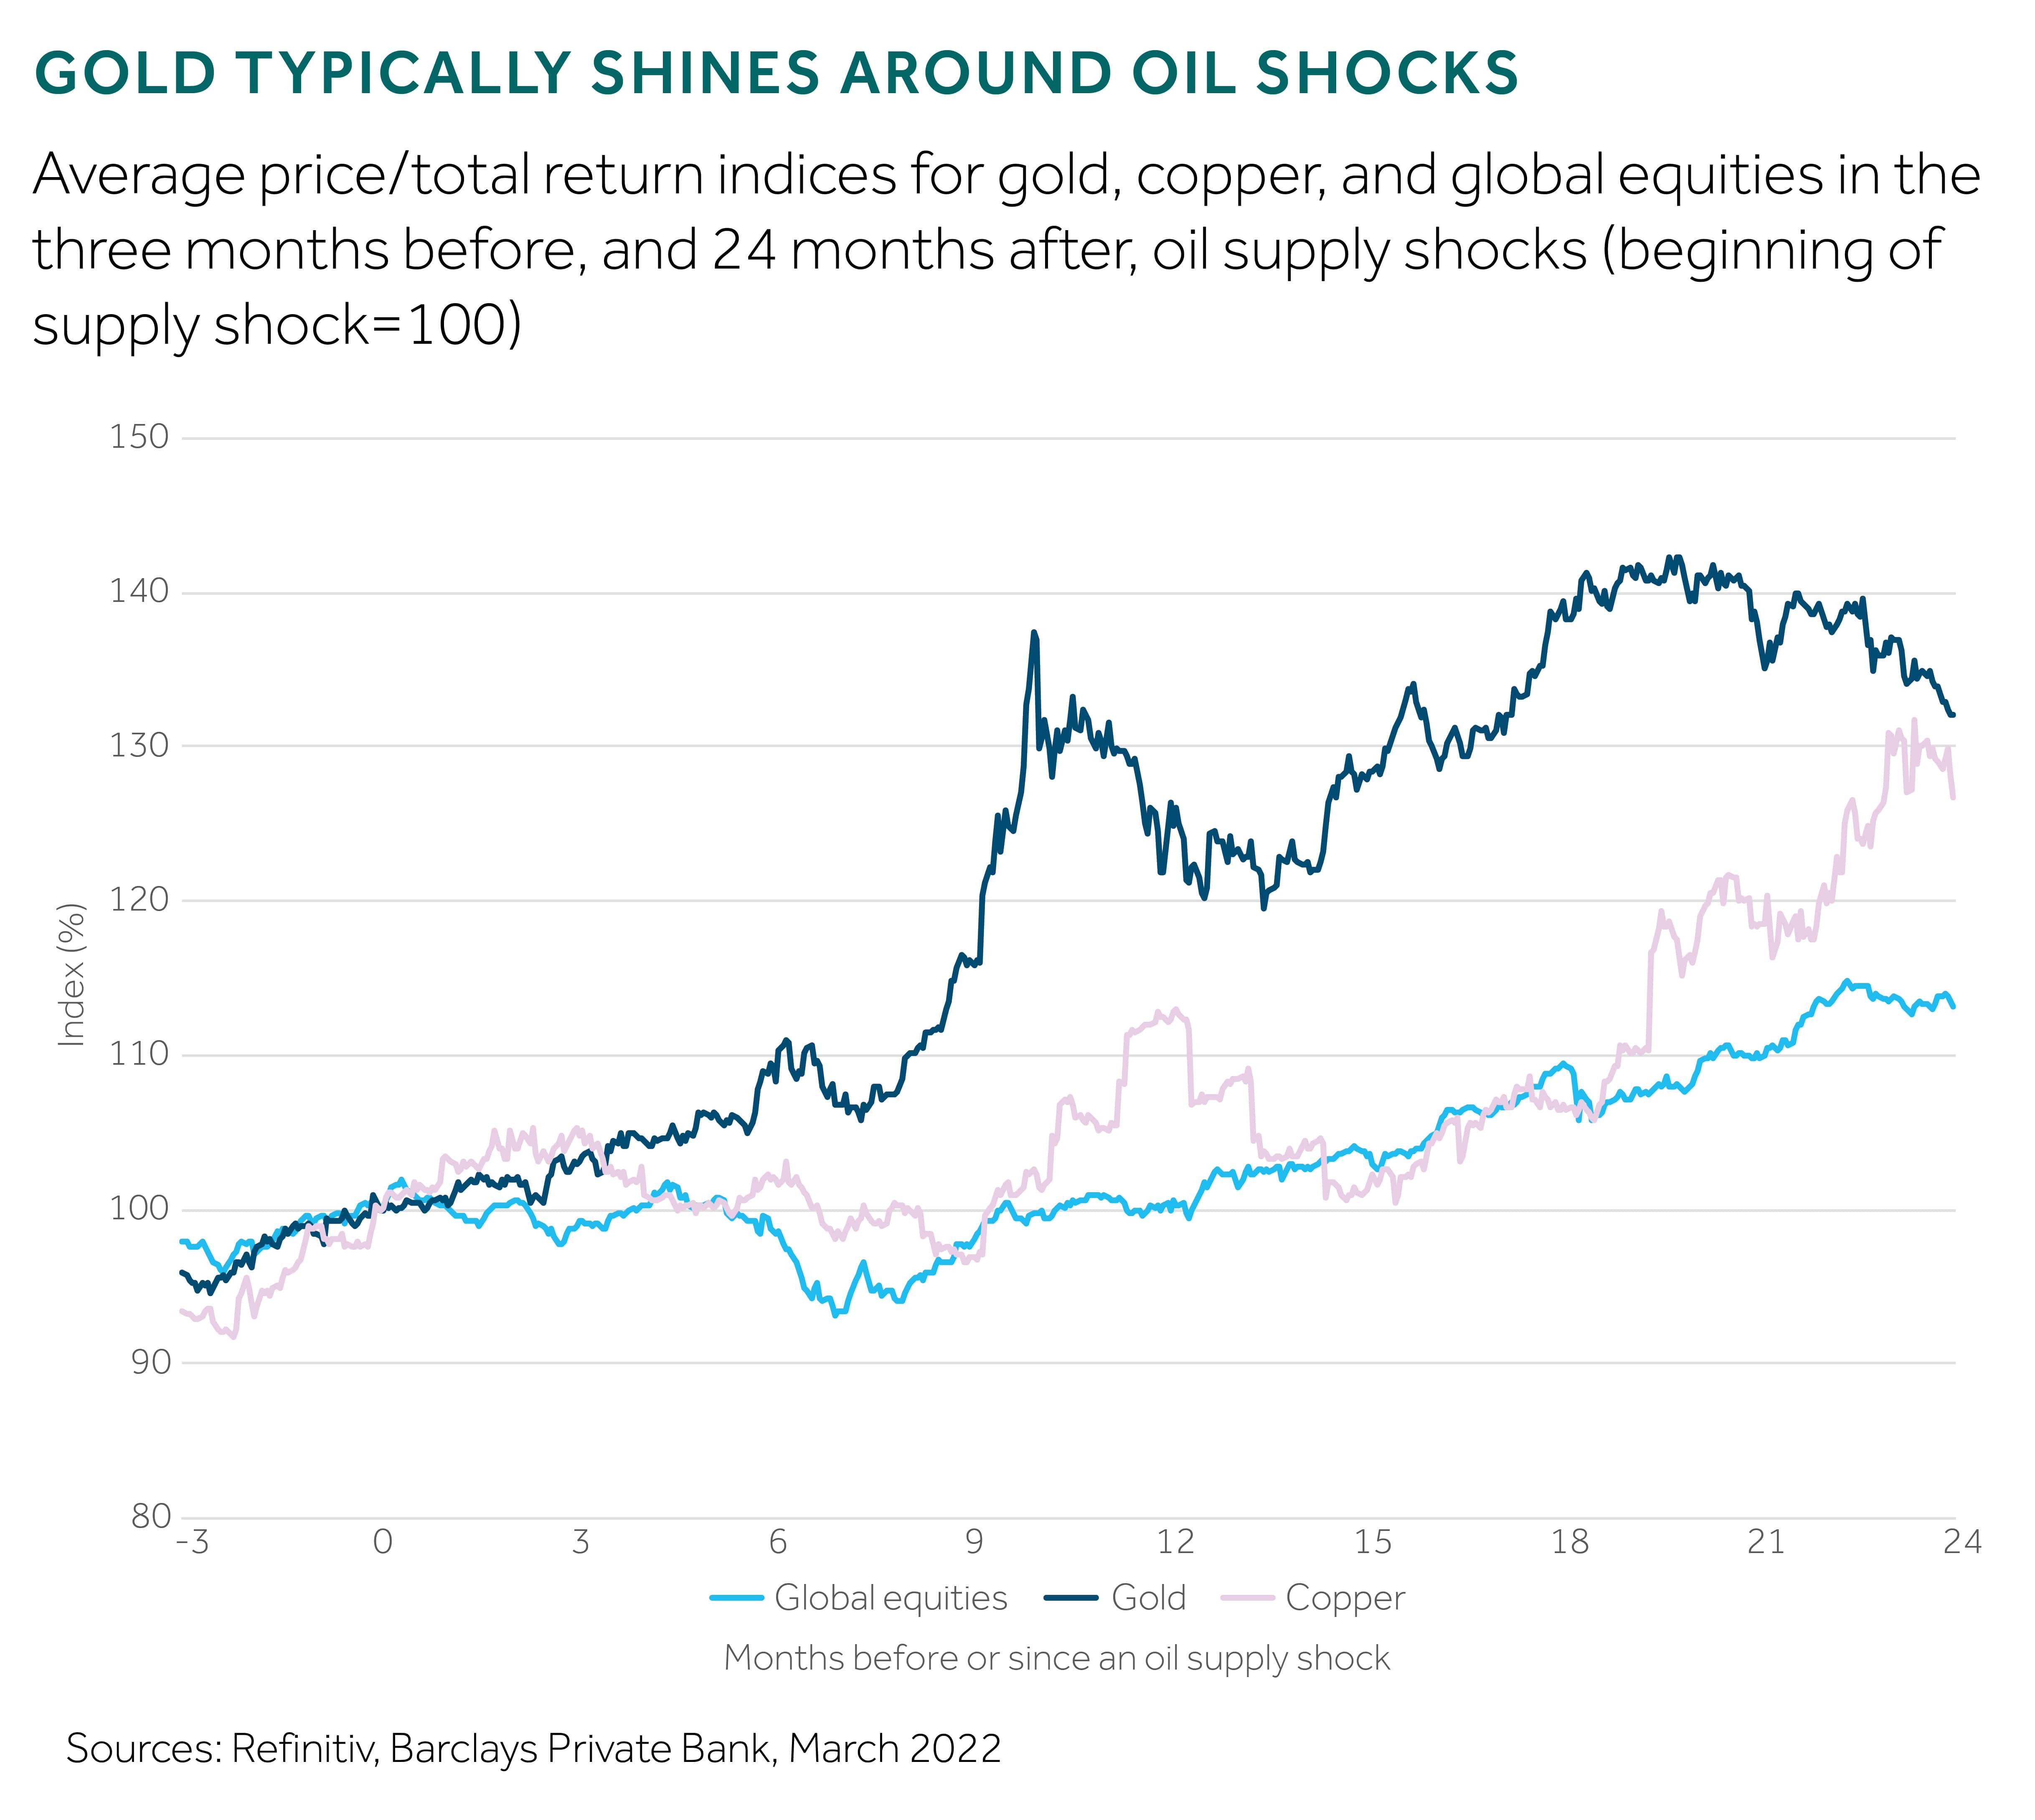
Historically, gold has been a strong performer in the months following oil supply shocks (see chart) – gaining, on average, 42% at its peak 20 months after the start of any oil shock. Copper – another portfolio diversifier – also outperformed global equities in these periods, but not on the scale of gold.
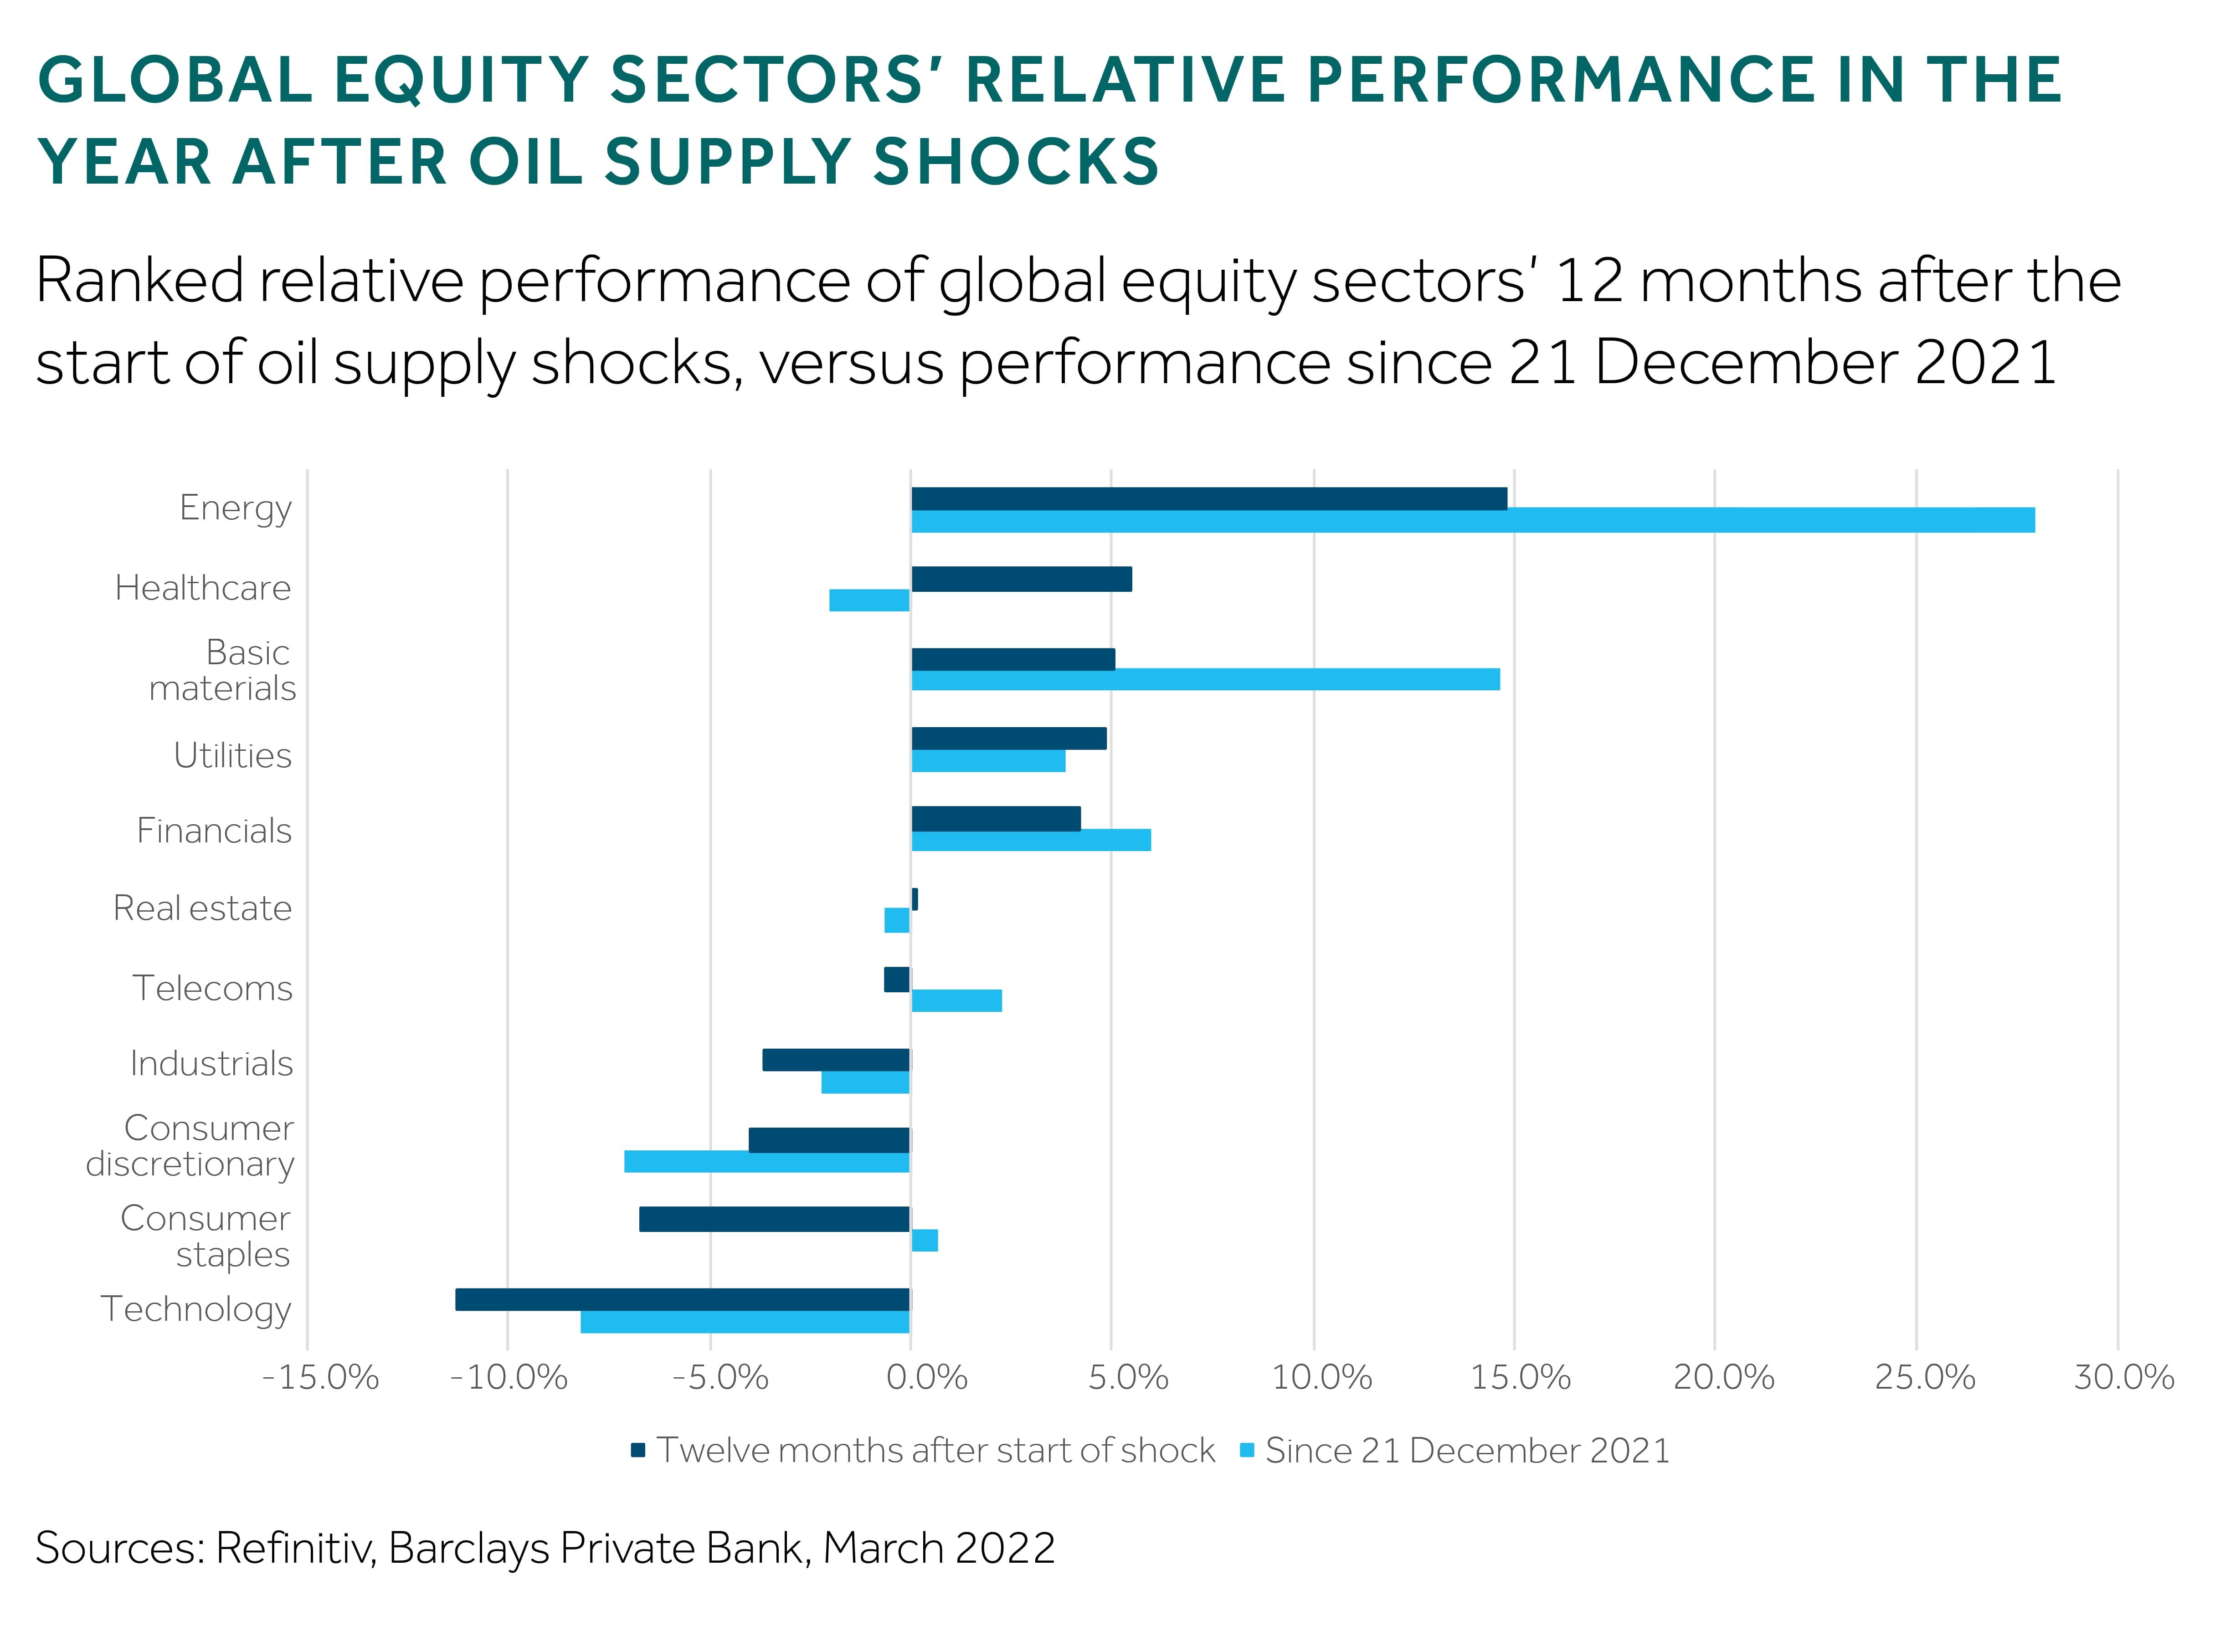
Turning to sectors, it’s probably no surprise that energy was the best performer following these oil supply shocks (see chart below). Defensive sectors, such as healthcare and utilities, also typically did well, although in contrast technology was the main laggard – underperforming the market by 11% on average.
And what about today’s crisis – what do we know so far?
At the height of the current shock – on 8 March 2022 – global equities had fallen 10% (against the historic average of -7%), and the price of gold had risen 15%.
That said, in previous shocks, equities have fallen faster, with gold also appreciating more rapidly. And in terms of sectors (see chart above), what we’ve seen has so far been broadly in line with historical trends – with energy the best outperformer today followed by basic materials, financials, and utilities. Again, the worst performing sector in this shock has been technology.
Related articles
Disclaimer
This communication is general in nature and provided for information/educational purposes only. It does not take into account any specific investment objectives, the financial situation or particular needs of any particular person. It not intended for distribution, publication, or use in any jurisdiction where such distribution, publication, or use would be unlawful, nor is it aimed at any person or entity to whom it would be unlawful for them to access.
This communication has been prepared by Barclays Private Bank (Barclays) and references to Barclays includes any entity within the Barclays group of companies.
This communication:
(i) is not research nor a product of the Barclays Research department. Any views expressed in these materials may differ from those of the Barclays Research department. All opinions and estimates are given as of the date of the materials and are subject to change. Barclays is not obliged to inform recipients of these materials of any change to such opinions or estimates;
(ii) is not an offer, an invitation or a recommendation to enter into any product or service and does not constitute a solicitation to buy or sell securities, investment advice or a personal recommendation;
(iii) is confidential and no part may be reproduced, distributed or transmitted without the prior written permission of Barclays; and
(iv) has not been reviewed or approved by any regulatory authority.
Any past or simulated past performance including back-testing, modelling or scenario analysis, or future projections contained in this communication is no indication as to future performance. No representation is made as to the accuracy of the assumptions made in this communication, or completeness of, any modelling, scenario analysis or back-testing. The value of any investment may also fluctuate as a result of market changes.
Where information in this communication has been obtained from third party sources, we believe those sources to be reliable but we do not guarantee the information’s accuracy and you should note that it may be incomplete or condensed.
Neither Barclays nor any of its directors, officers, employees, representatives or agents, accepts any liability whatsoever for any direct, indirect or consequential losses (in contract, tort or otherwise) arising from the use of this communication or its contents or reliance on the information contained herein, except to the extent this would be prohibited by law or regulation.